


Nielsen Music 2014 Year-End Report

2014 NIELSEN MUSIC U.S. REPORT
* * * * *
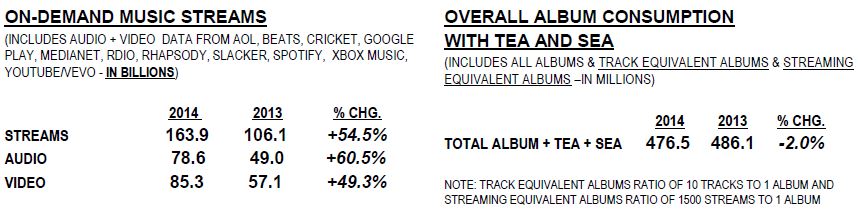
ON-DEMAND STREAMING UP 54% WITH 164 BILLION STREAMS IN 2014
* * * *
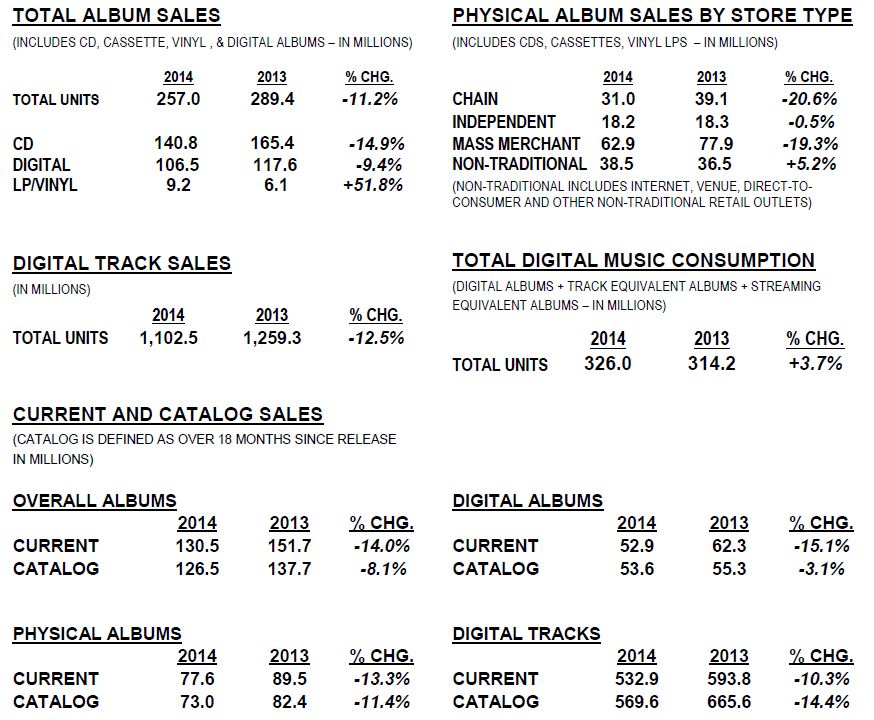
Vinyl LP Sales Increase 52% – Now Comprise over 6% of Physical Album Sales
* * *
Radio Remains Top Source for Music Discovery
NEW YORK – Nielsen, the music industry’s leading data information provider today released the 2014 U.S. Music year-end report for the 12-month period of December 30, 2013 through December 28, 2014.
Streaming continued to show significant growth in 2014, with over 164 billion songs streamed on-demand through audio and video platforms. Physical album sales declined, with weakness in CDs despite record-setting strength in Vinyl LPs. Digital Albums and Digital Tracks also showed declines versus 2013, although digital consumption overall (sales and streams) showed growth. Total consumption for the year, based on Albums plus Track Equivalent Albums and Streaming Equivalent Albums, was down slightly versus 2013.
“Music fans continue to consume music through on-demand streaming services at record levels, helping to offset some of the weakness that we see in sales,” says David Bakula, SVP Industry Insights, Nielsen. “The continued expansion of digital music consumption is encouraging, as is the continued record setting growth that we are seeing in vinyl LP sales.”
Nielsen provides music research and monitoring services for the entertainment industry. Nielsen’s airplay, sales and streaming data represents music consumers of all ethnicities and languages, and is featured weekly in Billboard’s charts, including the iconic Billboard Hot 100 and Billboard 200, and is widely cited as the standard for music measurement.

NIELSEN MUSIC 2014 YEAR-END HIGHLIGHTS AND ANALYSIS
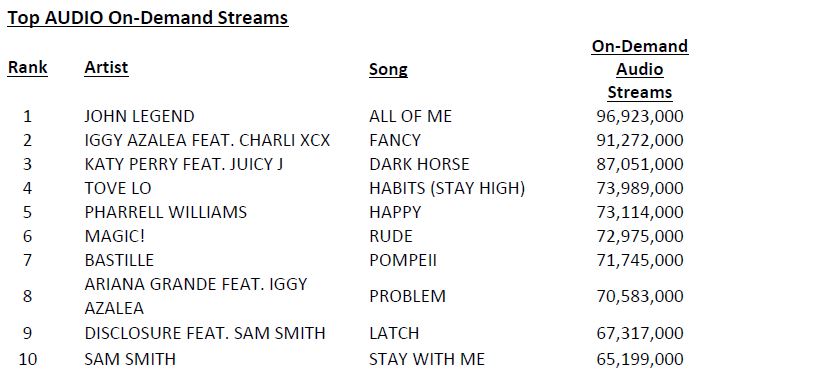
- On-Demand Streaming grew 54.5% over 2013, with Audio On-Demand (+60.5%) and Video On-Demand Streaming (+49.3%) both experiencing significant increases.
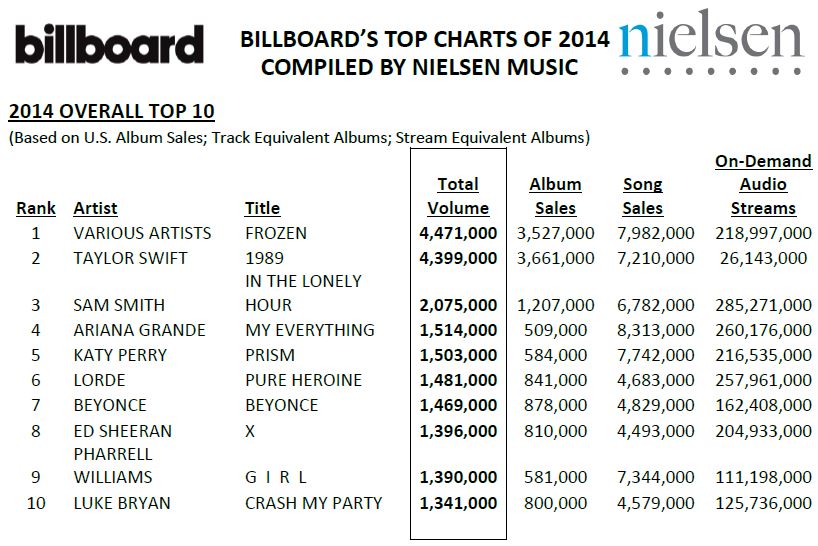
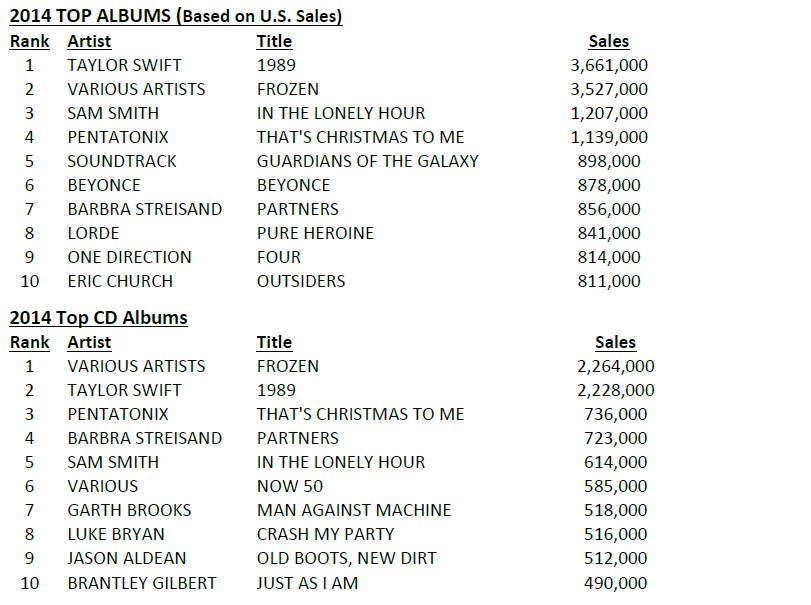
- The soundtrack to the movie Frozen ranked #1 for overall consumption this year (Album Sales + Track Equivalent Albums + Streaming Equivalent Albums) with over 4.47 million album equivalent units. Taylor Swift/1989 ranked second with 4.40 million units.
- Taylor Swift had the best-selling album of the year with 3.66 million sales for her album 1989. The album also had the best debut week of the year and the biggest opening week for an album since 2002 with nearly 1.3 million albums sold in the first week. 1989 also had the second biggest digital album sales week in history. In its debut week, 1989 comprised a full 22% of all album sales for the week.
- 2014 had two albums that sold over 3.5 million units during the calendar year (Taylor Swift’s 1989 and the Frozen Soundtrack) – this is the first time since 2005 that two albums have sold over 3.5 million albums in a calendar year.
- While the top two albums this year performed significantly better than last year’s top two albums, 2014 saw just four albums surpass 1 million units, compared to 13 last year. The top 10 albums in 2014 were virtually flat versus 2013, thanks to the strength of Taylor Swift and Frozen.
- Vinyl LPs had another record-breaking year, with 9.2 million sales, surpassing last year’s record of 6.1 million units. This is the ninth consecutive year of growth for Vinyl sales. Vinyl now comprises over 6% of physical album sales.
- 27 Vinyl LPs sold over 20,000 units in 2014, up from the 11 Vinyl LPs to reach that level in 2013.
- 94 Vinyl LPs sold over 10,000 units in 2014, up from the 46 Vinyl LPs to reach that level in 2013.
- Rock is still the dominant genre for Vinyl LPs, with 71% of Vinyl LPs being classified as Rock.
- The Independent store strata outperformed other brick & mortar retailers, with album sales virtually flat against last year. The strength was led by Vinyl LPs, which were up 35% at Independent stores.
- The Independent store strata had a record setting year with Vinyl LP sales, with 5.2M Vinyl LPs sold, making up 57 percent of all Vinyl sales.
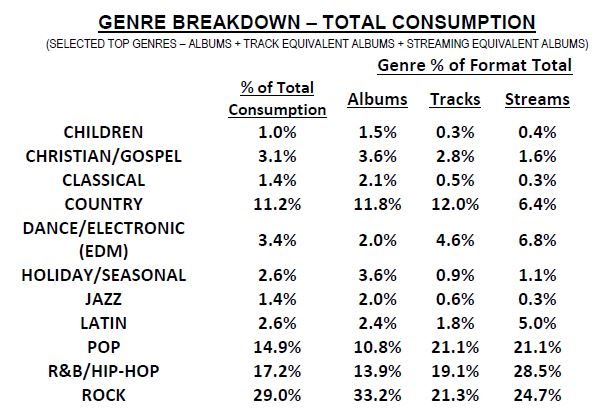
- Genres performed differently across the different types of consumption, showing how different music fans prefer to access their favorite music.
- Rock is the dominant genre for album sales (over 33% of albums) and of total consumption (29%). However, on a track sales basis, Pop (21.1%) is nearly as big as Rock (21.3%). R&B/Hip-Hop is the dominant genre for Streaming (28.5%) followed by Rock (24.7%) and Pop (21.1%).
- Country consumers still prefer Albums (11.8%) and Track Downloads (12.0%) over Streams (6.4%)
- Pop music consumers are buying individual hit songs much more than albums. While 21% of digital track sales are in the Pop genre, only 10.8% of album sales are Pop.
- Some genres, particularly R&B/Hip-Hop, EDM and Latin perform particularly well in Streaming.
- While R&B/Hip-Hop only comprises 13.9% of Album sales, it makes up 28.5% of Streaming.
- Electronic/Dance (EDM) only makes up 2% of album sales, but makes up nearly 7% of Streaming, making the genre a bigger share of Streaming than Country.
- Latin music also performs particularly well at Streaming, with 5% of Streaming coming from Latin music, while just 2.4% of album sales are Latin.
NIELSEN MUSIC:
OVERVIEW OF MUSIC CONSUMPTION IN 2014
Music consumption has changed, but America’s appetite for music remains as strong as ever.Changes in how fans are consuming music defined the 2014 music landscape.
- Streaming music is surging.
- Smartphone/mobile usage for music listening grew (as did smartphone and tablet ownership).
- Radio continued to be the number-one source of music discovery.
Americans still love music, and are listening all the time
- 93% of the U.S. population listens to music, spending more than 25 hours each week listening to their favorite songs.
- When surveyed about their activities in the past year, 75% of respondents said they actively chose to listen to music, even ahead of watching television at 73%.
- Nearly 25% of all music listening happens in the car; listening at work or while doing chores at home each account for around 15% of our weekly time spent with music.
- Listening to music on smartphones now exceeds listening to music on iPods, with 41% of listeners accessing music on their smartphones in a typical week, an increase of over 20% versus last year.
- Smartphone penetration grew from 69% at the start of 2014 to 76% of U.S. mobile subscribers by October 2014.

Streaming continues its surge – audio and video
- Nielsen Music tracked 164 billion On-Demand streams in 2014, up 54% in 2013 (106 billion).
- In a typical week, 67% of music consumers listen to music online (any form of streaming music).
- The week ending Nov. 9, 2014, marked the first time since Nielsen started tracking streaming in 2004 that total streams surpassed 4 billion in one week. Of these record-breaking streams –
- 3.9 billion were on-demand (audio and video)
- 1.845 billion were audio streams, making it the second highest week for audio streams ever
- The week was also a record high for video, with over two billion video streams
Source: Nielsen Music 360 2014, Nielsen Music Connect
Source: Nielsen Music 360 2014, Nielsen Music Connect
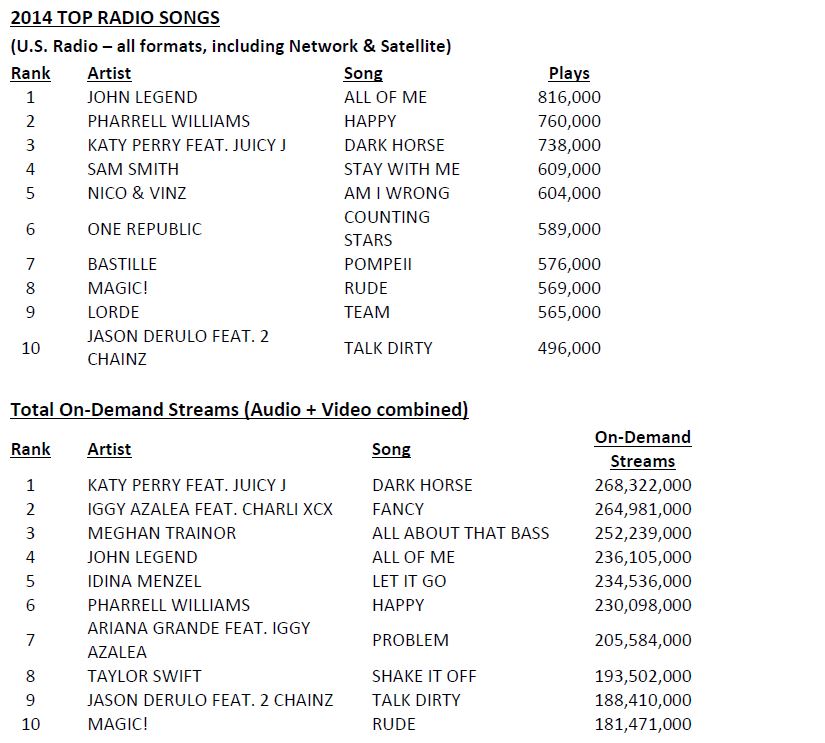
Radio Remains Top Source for Music Discovery, With Pop and Country Leading the Way
Radio remains the top method of music discovery, and its local nature makes it an integral part of the daily lives of hundreds of millions of consumers in markets large and small. 51% of consumers use radio to discover new music.
- 59% of music listeners use a combination of over-the-air AM/FM radio and online radio streams to hear music
- 243 million U.S. consumers (aged 12 and over) tune in each week to radio. That’s 91.3% of the national population tuning in across more than 250 local markets.
- Across the 48 Nielsen portable people meter (PPM) markets, Pop Contemporary Hit Radio (CHR) and Country were the leading music formats amongst all listeners in 2014, followed by Adult Contemporary (AC), Hot AC and Classic Hits.
- Country radio grew significantly with 18-to-34-year-old audiences through the first half of the year, peaking in June with its all-time best audience share, before ending the year on a downtrend. For the year, Country ranked second across the Nielsen PPM markets.
- Hot AC increased its share of audience, moving from fifth to third this year among audiences aged 18 to 34. 2014 marked the best year ever for the format.
Source: Nielsen Audio

Consumers might not be buying as many CDs, but they are still spending on music
- On average, consumers spend $109 annually on music activity.
- On average, live music events account for just over half of total music activity spending.
- Festivals are gaining steam: 32 million people attend at least one festival a year (12%).
- Festival-goers spend more than typical music listeners on all forms of music overall (e.g. digital purchases, streaming, other live events, etc.).

Source: Nielsen Music 360 2014, Nielsen Music Audience Insights: Festivals
Music on
Music on Television
Just a few years ago, televised award shows were in a ratings tailspin. Fast forward to 2014, and the advent of social media, and it is a very different story.- In 2014, music award shows reached a television audience of 115 million viewers and sparked 47 million comments on Twitter.
- The 2014 Grammy Awards show averaged 28.5 million viewers, up slightly from last year and the second largest audience in 21 years.
- The most-tweeted minute of the 2014 Grammy Awards was during the Kendrick Lamar/Imagine Dragons performance which garnered 143k Tweets at 9:50pm EST on January 26, 2014.
- The 2014 Billboard Music Awards Show averaged 10.5 million viewers, an increase of 13% from the previous year.
- The Country Music Awards show saw an increase in the number of teens (up 12 percent from 2013) and kids (up 14 percent) tuning into the broadcast, likely buoyed by performances from Ariana Grande and Meghan Trainor.
- TV Music Award Show viewers in general are heavily female, with the most highly concentrated segment of viewers between the ages of 18-24.
- Audience engagement is higher for award shows than other programming; over 15% higher than newscasts and 40% higher than sports.
- For 2014’s Top 10 Specials for Twitter TV Ratings, 9 of the 10 were Entertainment specials, and half were music specials.
- The most-tweeted minute of 2014 for a television series was The Voice (NBC), which garnered 310,000 Tweets at 8:59pm EST on May 13, 2014.

Source: Nielsen, Nielsen Music 360, Nielsen Music Audience Insights: Award Shows
Global Top 10 Artists, Based on Social & Web Engagement
Social/Web Engagement in 2014 based upon growth in Global Facebook Likes, Global Twitter Followers
& Global Wikipedia page views.
1. Shakira
2. Taylor Swift
3. Ariana Grande
4. Katy Perry
5. Justin Bieber
6. Eminem
7. One Direction
8. Jennifer Lopez
9. Justin Timberlake
10. Selena Gomez
& Global Wikipedia page views.
1. Shakira
2. Taylor Swift
3. Ariana Grande
4. Katy Perry
5. Justin Bieber
6. Eminem
7. One Direction
8. Jennifer Lopez
9. Justin Timberlake
10. Selena Gomez
Source: Nielsen Music Connect
About Nielsen
Nielsen (NYSE: NLSN) is a global information and measurement company with leading market positions in marketing and consumer information, television and other media measurement, online intelligence and mobile measurement. Nielsen has a presence in approximately 100 countries, with headquarters in New York, USA, and Diemen, the Netherlands. For more information, visit www.nielsen.com.
Nielsen (NYSE: NLSN) is a global information and measurement company with leading market positions in marketing and consumer information, television and other media measurement, online intelligence and mobile measurement. Nielsen has a presence in approximately 100 countries, with headquarters in New York, USA, and Diemen, the Netherlands. For more information, visit www.nielsen.com.
For more information, contact:
Anna Loynes, aloynes@solters.com
Anna Loynes, aloynes@solters.com

No comments:
Post a Comment